
AWARDEES: Christian Che-Castaldo, Heather Joan Lynch, Mathew Schwaller
FEDERAL FUNDING AGENCIES: National Aeronautics and Space Administration, National Science Foundation
Where there’s poop, there are penguins — that was the logic of a scientist who noticed that bright pink penguin poop appeared on satellite images. The idea set in motion a 40-year mission to track penguin populations via satellite imagery, leading to the discovery of 1.5 million previously undocumented Adélie penguins and a whole new way to track wildlife. Monitoring the rapidly warming Southern Ocean ecosystem gives us a glimpse into future climate change impacts, and satellite monitoring has allowed researchers to track animal populations in areas that are too difficult or dangerous to reach in person, saving federal dollars by making field research expeditions more targeted and efficient.

Mathew Schwaller
How to Pick up Poop
Mathew Schwaller always knew he wanted to be a scientist. A graduate student at the University of Michigan in the 1980s, Schwaller was studying remote sensing, which uses satellites to scan the earth’s landscape. He thought it was a wonderful way to look at the world, expanding the understanding of the earth’s surface all the way from space.
Schwaller’s dissertation advisor, Bill Benninghoff, was an Antarctic buff who kept pebbles from a penguin colony and a stuffed Adélie penguin in his office. It was Benninghoff who approached Schwaller about trying to study Adélie penguins from satellite images — something that no one had attempted before. Schwaller decided it was worth a shot.

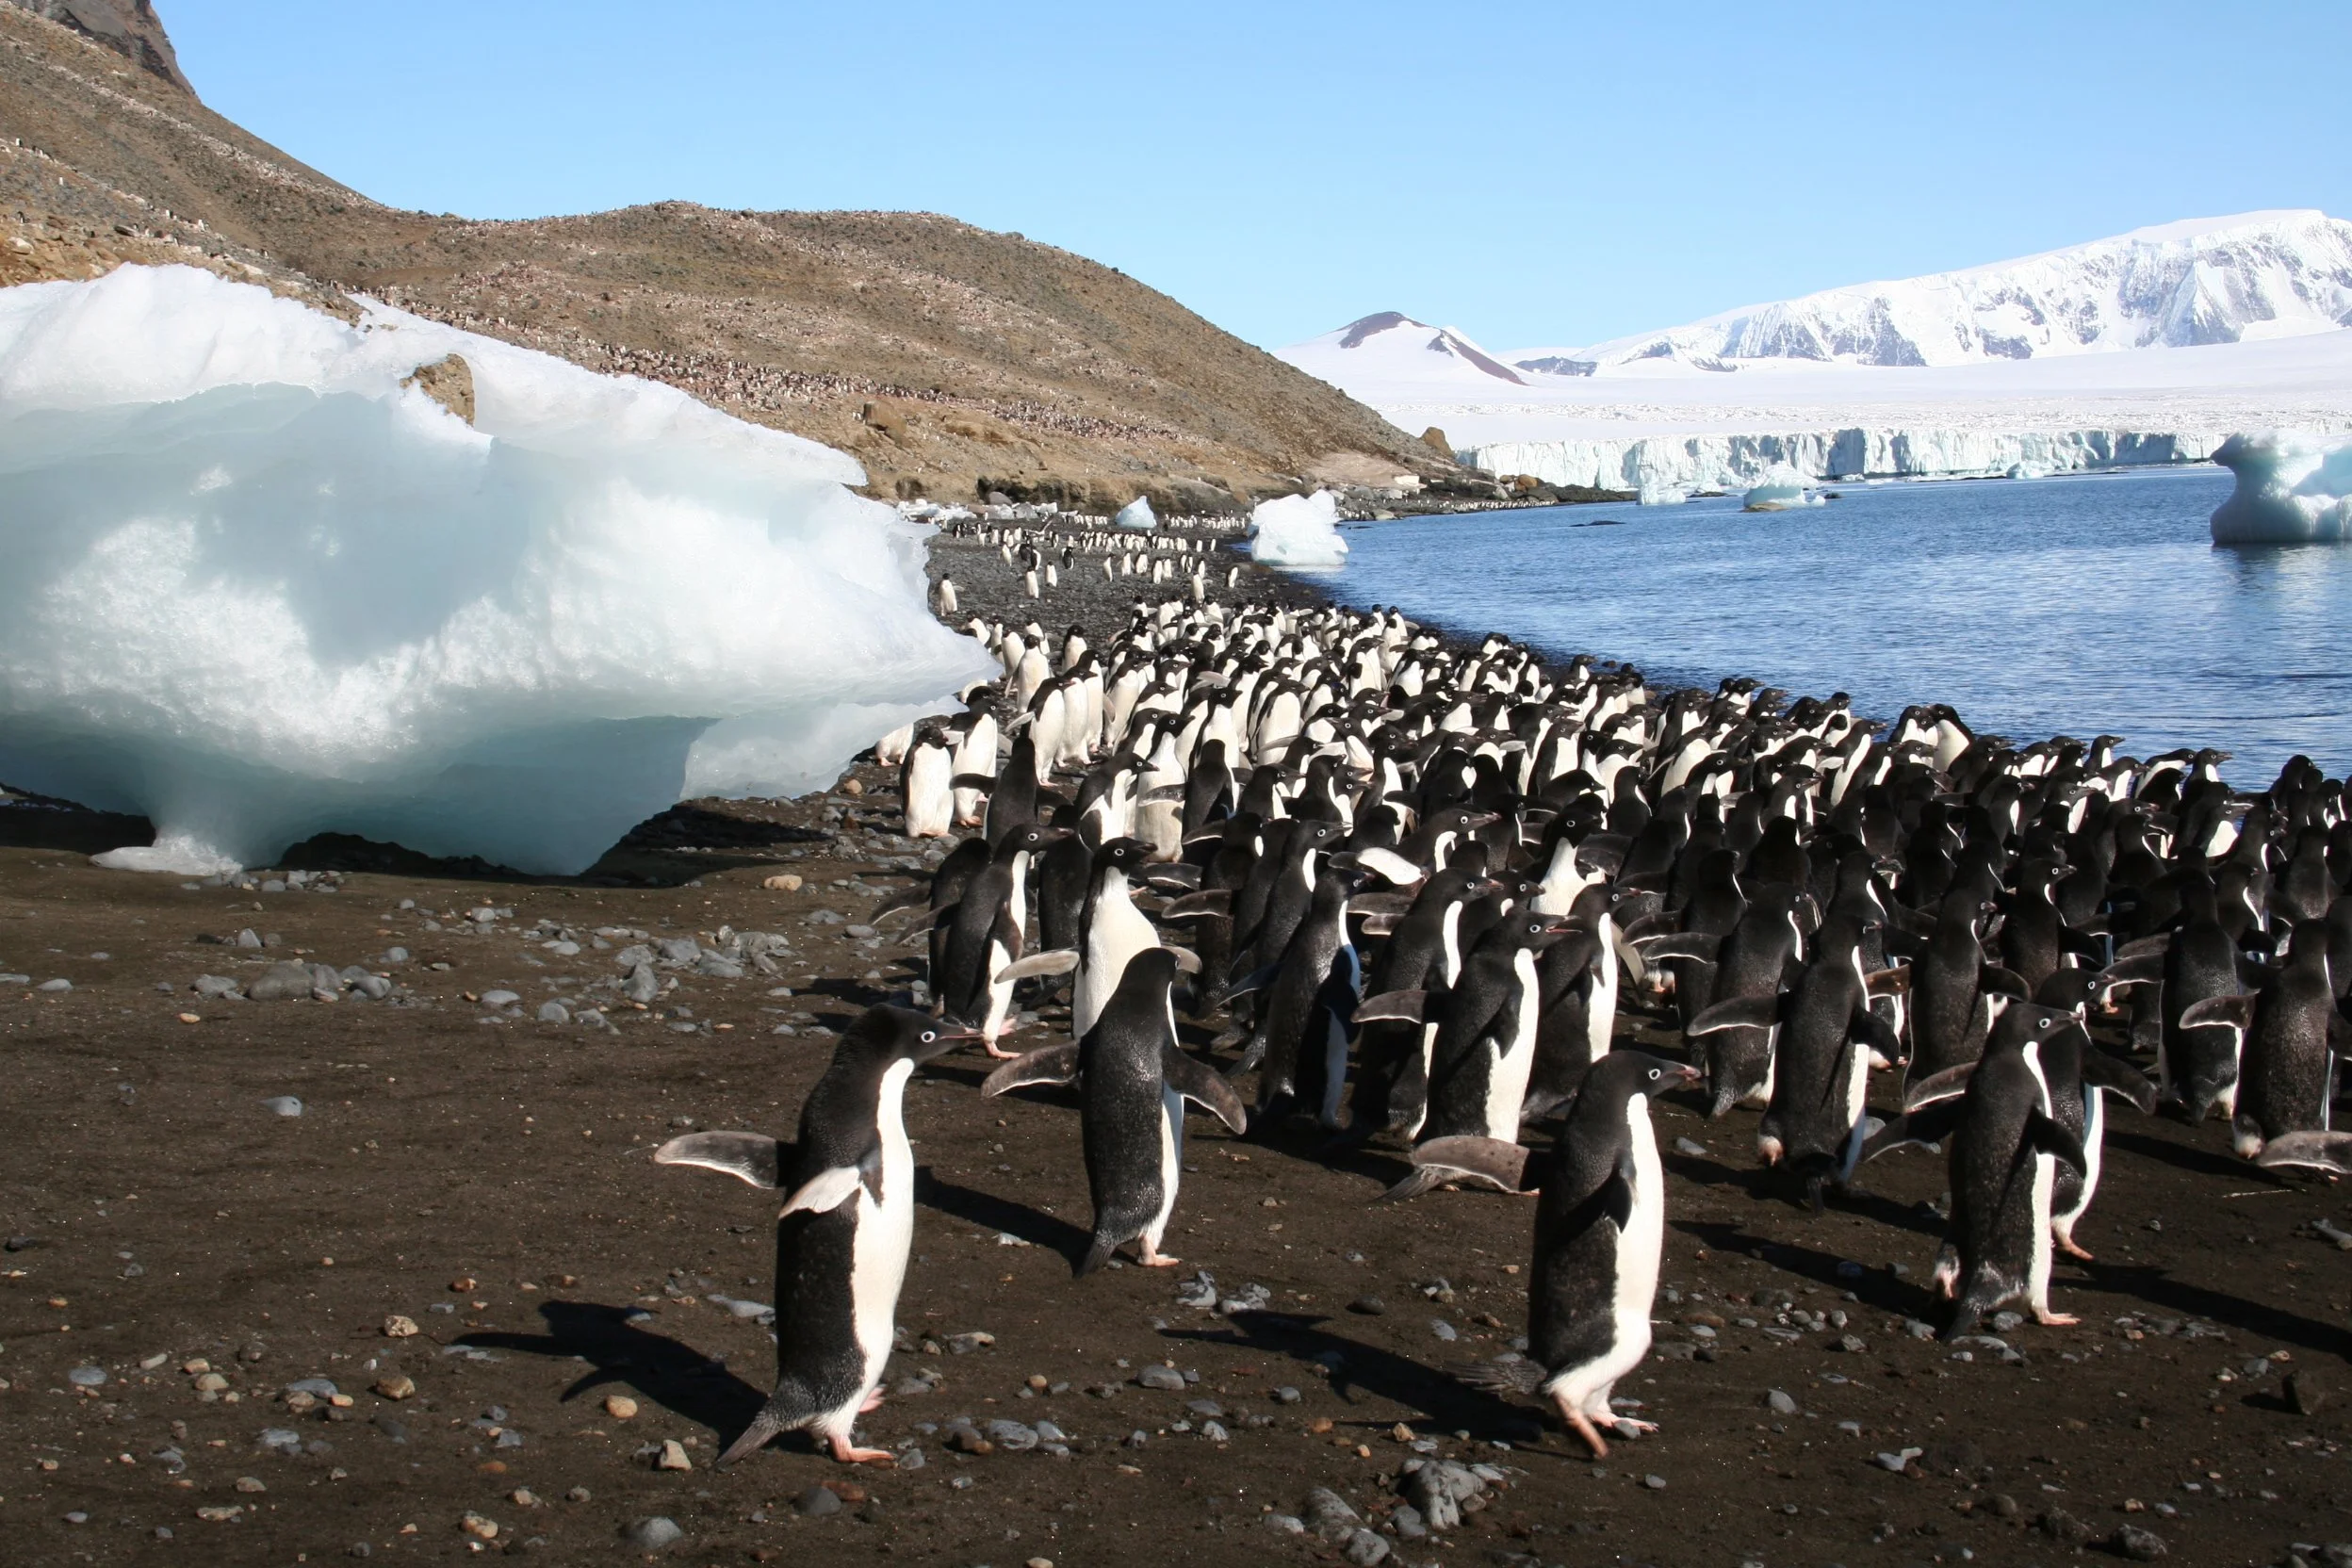
Adélie penguins (Heather Lynch)
Standing less than two feet tall, Adélies sport the classic penguin tuxedo: black body and head with a white belly. Adélies form densely packed colonies to breed and raise their chicks, leaving behind bright pinkish-red poop that stands out on the Antarctic landscape, which is largely rocks, ice, and liquid water. The characteristic guano color comes from the birds’ diet of krill, tiny reddish aquatic crustaceans that look like shrimp. Since individual penguins were too small for satellites to capture, Schwaller decided to use the bright guano stains as a proxy for penguin colonies.
In 1983, Schwaller started collecting the measurements of Antarctic materials like penguins, rocks, and ice to simulate what the satellite could “see.” He developed a basic algorithm that distinguished the guano from its surroundings. This type of algorithm drew a circle around the penguin colonies — it “looked” at a pixel and asked, “Does this fit within the circle or not? Is it pink poop or not?”
An Eye in the Sky
The satellite series known as Landsat launched in 1972 as a collaboration between NASA and the U.S. Geological Survey to track how the earth’s landscape changed over time. On the first satellite launch (Landsat 1), scientists used a radiometer, an instrument similar to a modern cell phone camera, to process frequencies of light coming through the lens and interpret those values into color images. That radiometer only had a resolution of 90 meters (about the size of a football field), but by Landsat 4, an updated instrument called the Thematic Mapper scanned more components of the spectrum of light with a resolution of 30 meters, three times the initial resolution.

Schwaller collects data (Mathew Schwaller)
In 1986, funded by NASA and the National Science Foundation, Schwaller took in-person radiometric measurements in Antarctica near the McMurdo Antarctic Research Station and laid out a plan for a continent-wide Adélie penguin survey. Unfortunately, he hit a roadblock. At that time, Landsat data was recorded onto physical data storage tapes. To cover the entire Antarctic continent would require a stack of tapes over 100 feet tall, totaling $600,000 in tape costs alone. Plus, researchers would have to load the tapes onto a computer to read them individually. “I mean, how did we ever get anything done?” asks Schwaller today.
So Schwaller put his idea on ice while working a NASA job with other research priorities. But his interest in penguins didn’t fade. In 2008, USGS committed to free and open access to Landsat data, and Schwaller saw his chance to do the type of research he had been envisioning for decades. Accessing the data was game-changing, says Schwaller; “If I had a soap box to stand on, I would say, make that data free and release it to the people.”
Additionally, by 2008 computer processing power had increased dramatically — data that required use of a computer the size of a room now just required a laptop. The data from a stack of tapes now fit easily on a thumb drive.
Schwaller re-started his research on nights and weekends, and by 2010, he had a working algorithm to identify penguin colonies. “I was basically an amateur when it came to the penguins,” says Schwaller, “but the root of amateurism was that I really loved it.”

Heather Lynch
Assembling the Team
While Schwaller was working on his algorithm, a researcher named Heather Lynch was studying physics. But about three years into a Ph.D. in experimental physics at Harvard University, she started to hear about climate change. She attended one of Al Gore’s “Inconvenient Truth” PowerPoint presentations — long before it became the award-winning documentary film most people are familiar with — and though Lynch loved her physics research, she felt called to study environmental science.
Lynch transferred to the ecology and evolution research track but decided to use satellite remote sensing, using the same computational and mathematical methods that she already knewwas familiar with. After graduating, Lynch was introduced to the study of penguins in her postdoc lab.
Once Lynch started her research lab at Stony Brook University, she decided to combine her previous research areas and use satellite imagery to study penguin populations. One name that kept popping up in the scientific journal articles she read was Mathew Schwaller, who had laid the groundwork for satellite surveys of penguins. The papers were out there, but Schwaller had vanished from the penguin mapping scene. Lynch heard through the grapevine that he was still interested in penguin research, and the pair connected in 2014.

Christian Che-Castaldo
“It would be like meeting Shakespeare, or somebody that you've heard about that was just a name on paper,” says Lynch. “It was very exciting for me.”
Lynch also reached out to a colleague she’d met during her postdoc, Christian Che-Castaldo. He was an economist-turned-ecologist who had a penchant for both statistics and nature. Says Lynch, “Anybody who knows Chris would say that he is the most detail-oriented person on the face of the planet.” That was exactly the type of researcher Lynch was looking for.
The three scientists had complementary specialties — Schwaller and Che-Castaldo focused on algorithms and modeling the Landsat imagery, while Lynch had experience in the biology of penguins and the environment, as well as interpreting high-resolution satellite imagery.
The Known Knowns, Known Unknowns, and the Unknown Unknowns
Monitoring animal populations is hard, especially in a remote, harsh environment like Antarctica. Every year, Adélie penguins show up to their breeding site, where they hatch their chicks. Historically, that is when researchers could travel down to Antarctica in person and count the penguins. Given that there are hundreds of colony sites in Antarctica, and traveling to the Antarctic is expensive and sometimes dangerous, historical data on penguin populations is quite sparse. Lynch recalls a book in her office that contained all the data previously collected on penguin populations. It was a bit of a mess — there wasn’t even a standardized naming or location system.
Lynch envisioned wrenching all this penguin data into the 21st century via an online database. She wanted to document every Adélie penguin colony in Antarctica and its population over time. Supported by an NSF career award and a NASA grant, Lynch and her collaborators jumped in, and quickly their ambitions grew from documenting just the Adélie penguins to all the penguin species living in Antarctica.
A rather straightforward task quickly ballooned. The data took years to assemble because of how unstructured and disorganized the system for tracking penguins had been. Lynch compares it to an archaeological dig, cleaning dirt from bones with a toothbrush. But what resulted was a Mapping Application for Penguin Populations of Protected Dynamics, or MAPPPD, an invaluable resource for Antarctic researchers that is being continuously updated with new population counts.

MAPPPD website
Still, Lynch was manually processing high-resolution commercial satellite data, scanning for penguin colonies one image at a time. Because the interpretation was so challenging — Lynch describes it like trying to make sense of an ultrasound — it wasn’t easy to delegate among a larger number of analysts. This method worked, but it wasn’t efficient. If the researchers wanted to survey the entire Antarctic continent year after year, they needed to consider other options.
Discovery in the Danger Islands
In the meantime, Schwaller and Lynch continued to lean into the Landsat satellite imagery that had started the whole effort. In 2014, Schwaller identified what appeared to be several huge colonies of Adélie penguins nesting on the Danger Islands in Antarctica. Initially fearing the algorithm had made a mistake, Lynch re-examined these same islands with higher resolution image and realized that these really were penguin colonies, and possibly some of the largest that were known to exist. The islands, which sit in a cluster east of the northern tip of Antarctica and stretch across only about 9 miles of ocean, are aptly named. Field research on the islands is difficult, and the last in-person ground count of Adélies was in 1996. “It’s thrilling when you see something like that pop up,” Schwaller remembers.

Lynch counts Gentoo penguins (Casey Youngflesh)
With proof of concept in hand, the researchers launched an expedition to the Danger Islands region and beat the odds; they managed to get in on a small boat to survey each of the islands up close. By combining the satellite imagery with ground and drone-based surveys, the team added over 1.5 million Adélie penguins to the global census, more Adélie penguins than the rest of the Antarctic Peninsula region combined. The Danger Islands were not considered biologically important, but due to the discovery of the colonies and their ecological value, they are now protected as an Antarctic Specially Protected Area and have been incorporated into a proposed Marine Protected Area for the western Antarctic Peninsula.
More discoveries followed in the years since. Researchers found Gentoo penguins moving into areas newly uncovered by melting glaciers, and satellites were used to complete a global Chinstrap penguin population assessment. Before satellites, “Entire populations of those birds could disappear, and you wouldn’t even know it,” worries Schwaller. But it’s one thing to know that monitoring is technical possible and an entirely different matter to build a system that can do it autonomously, at scale, and use the data in a way that is meaningful for conservation and policy. That’s where data science comes in.
Data Science to the Rescue
It was a radical idea, Che-Castaldo reflects, to try to monitor an animal’s population continuously on a global scale. But that was the goal: Build models that could depict fluctuations in penguin populations across Antarctica.
The piecemeal data was a hurdle once again. One site might have had two counts over the past 30 years, whereas another site had 25 counts over the same period. This made it impossible to reconstruct the abundance in a larger region because researchers never had accurate counts to sum up the total over a larger area. Che-Castaldo and Lynch spent years trying to build a model that could uncover the relationship between environmental factors and the growth rate of penguin populations. They used a modeling approach called Bayesian hierarchical modeling, which would allow them to use information from a site that had more data to get closer to an accurate number for a site with less data. This approach provided an estimate of every site’s population in every year, allowing regional population estimates that were more useful for policymakers. The team built increasingly sophisticated statistical models, ultimately linking about 270 Adélie penguin colony sites. This was a big undertaking, and, explains Che-Castaldo, only in the last 20 to 25 years have computers become fast enough to create a model like this.
Building uncertainty into the model was another issue Che-Castaldo ran into. Uncertainty gives scientists a more robust picture of data quality. For example, if a team of researchers is counting the number of eggs at a penguin colony while the weather is good, and the researchers arrive at the same number of eggs, they can be very certain about the count. But if heavy snow limits visibility and buries the nests, the researchers are more likely to miscount, so they’re less certain the number is accurate.
The result was an enormously detailed picture of how Adélie penguin populations had changed over the last 40 years. When Che-Castaldo and the team published a scientific article on his model, Lynch tried to print out the supplementary materials for proofreading. “My computer said, ‘printing page 1 of 620,’” she recalls. “It was the Cadillac of models.”
Ultimately, the team knew the model would never be perfect because they could never fill in all the Swiss cheese-like holes of the data with the kind of accuracy they wanted. But the model was useful — if they had population counts from the years 2010 and 2013, the model could make a good guess at what happened in 2011 and 2012.
The team hasn’t stopped perfecting their work. In 2017, they ran a competition with a data science company to see who could build the best predictive model of penguin population dynamics. It was an eye-opening experience, partly because some of the best models were actually quite simple.
The team, led by Che-Castaldo and Schwaller, are also working on layering the entire 50-year history of Landsat images of the Antarctic, one on top of the other, with the goal of following population trends at each colony over time. And Che-Castaldo is working on new ways to build the uncertainty in observing penguins from space into the statistics of the population model himself, much like he did for the uncertainty in counting penguins from the ground.
Sky-High Science, Grounded Impacts
The Antarctic is a worthwhile ecosystem to keep an eye on — it’s a canary in a coal mine, of sorts. The climate is warming more rapidly at the poles, so monitoring its changes provides a glimpse into what could happen in other regions of the globe. Researchers have also detected bird flu on the outer islands of Antarctica, an important bellwether for public health researchers working to track potential zoonotic disease outbreaks.
The satellite population monitoring techniques established by Schwaller, Lynch, and Che-Castaldo have spread. High-resolution satellite imagery has developed to the point where one pixel is about the size of a piece of printer paper, so sometimes a proxy (like a guano stain) isn’t even necessary — the body of an animal is enough. Scientists are now tracking walruses, seals, African elephants, and even cows in pastures using this technology. Lynch was recently approached about collaborating on a research project tracking mammals in Kazakhstan near Chernobyl, where scientists cannot physically visit due to radiation levels.
Despite all the progress in satellite and computing and computer vision, monitoring populations via satellite imagery isn’t going to replace field work for researchers anytime soon. Lynch views it as an opportunity to enhance research capacity, plus increase safety and efficiency. She estimates that her trip to survey Elephant Island in Antarctica, where there were about two dozen colonies, cost around $600,000. It required a dedicated research vessel for about 20 days, which runs $10-15,000 per day, plus personnel, equipment, and a litany of other costs. And that’s just one expedition. Lynch said in a previous interview:
“We’re far from a point where satellites are going to make field work irrelevant. Instead, it has made fieldwork more efficient. We can plan expeditions to target colonies of high interest, and satellites have made expeditions much safer because we know so much more about what to expect. There is a nice synergy between satellite-based surveys and field surveys that I expect will be the status quo for a long time.” (NASA)
The number of earth-observing satellites operating will likely only grow in the future. The entire remote sensing field is expanding rapidly, transforming the way ecologists study the planet and all that lives on it. The idea hatched by Schwaller 40 years ago was ahead of its time, but its time has now come. And in the meantime, Lynch, Schwaller, and Che-Castaldo are keeping their eyes on the Antarctic for more prospective discoveries.

Schwaller at a penguin colony (Mathew Schwaller)
By Gwendolyn Bogard